

I messed up.
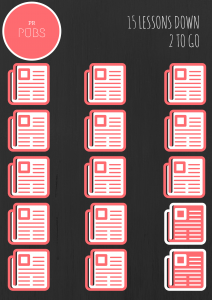
So maybe we weren’t actually supposed to make an infographic this week after all. Oh well. This is what mine would have looked like.
Obviously, I have decided to use Canva as my medium. I really like the ease of use of the website. It’s simple and hard to have a finished project that doesn’t look good. Upon playing around with it, I found that infographics are harder than I originally thought. I found a lot of cool charts that I wanted to use, but I wasn’t able to edit them to my liking. I could change the numbers, but half the time, I couldn’t change the percentage visually (if that makes sense). I’ll need to do more practicing when I do this for real.
I liked the Analysis-Synthesis Bridge Model that we used in the early portion of this class. The Pinterest posts we did helped me lay out my inspirations and ideas in a way that made them easy for me to apply on my final product. I’ll likely search for some infographics I find appealing and try to take what I like from them and use it on my final project.
It was interesting to see how far I’ve come in the semester. I have a much better eye for design now. I almost can’t stand to look at my business card anymore. My favorite two things I’ve done are the Newsletter and the Canva blitz. I think they both outdid my personal expectations. I hope I can surprise myself again with this final project.


Comments