

This is the end.
This final project was really great in that it really made me appreciate just how far I have come. When I started this class, my only previous experience with Adobe design programs came in the form of high school electives many moons ago. This is really the only design-based course in the degree plan for PR students, so I was unsure of what to expect. I loved it.
In my previous coursework, I have learned how to research, identify stakeholders, and create recommendations for marketing and that sort of thing. It was so nice to finally be able to bridge the gap between the conceptual and the concrete. This class has given me the tools to implement everything I’ve learned thus far and create a tangible product.
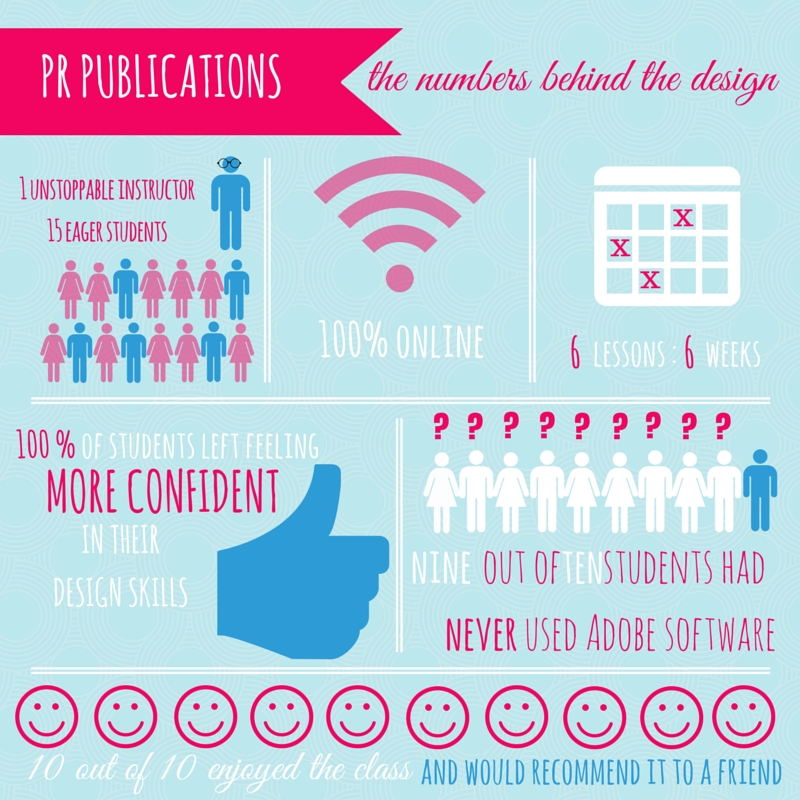
Having said that, an infographic was not my first choice for a final project. I got about halfway through a GoAnimate video and my (lovely) computer forced the page to reload, erasing everything I had thus far–I know, I’m still crying on the inside and outside. Creating an infographic posed a challenge of a different kind. Infographics are largely number based and I don’t exactly have a book of statistics and fun facts on this course…so I did my best. I used it as an opportunity to sum up the experience I’ve had so far this summer and to recommend it to others. Enjoy!


Comments